Dashboard & Analytics

Feature 6

Dashboard & Analytics

Your real-time business command center with charts, KPIs, and activity feeds.

What is it?

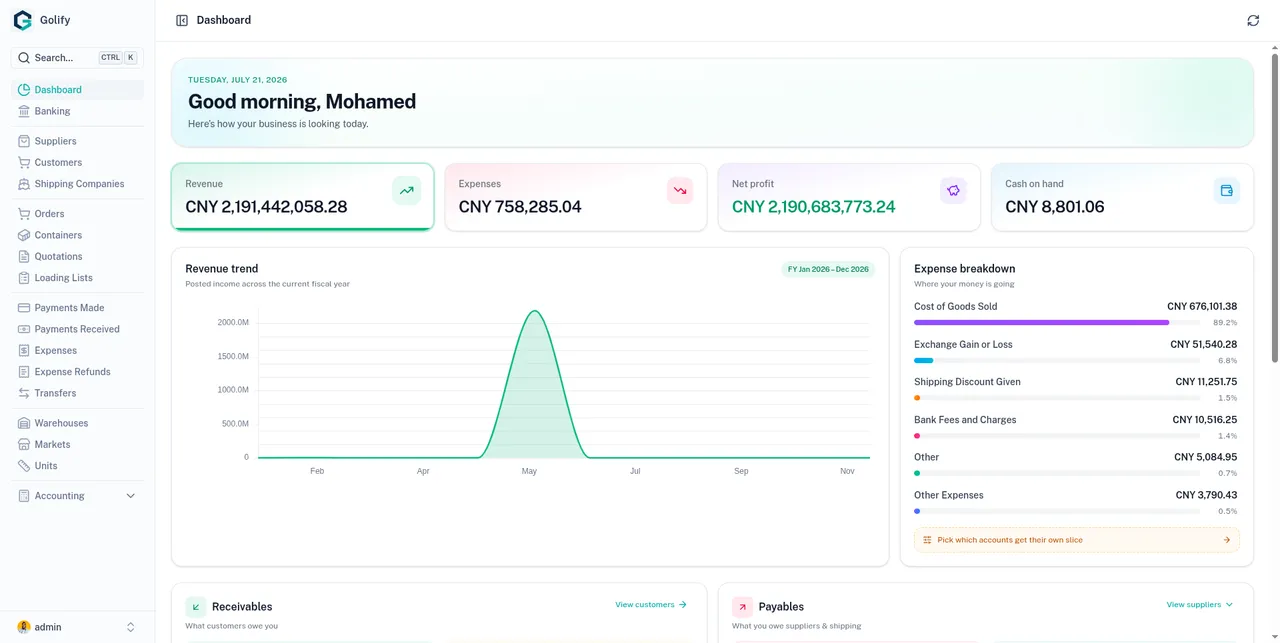
Your real-time business command center. See revenue, expenses, receivables, payables, and recent activity at a glance. Charts and KPIs update automatically from your transactions.

app.golify.com/dashboard
Golify dashboard with revenue, receivables, payables and recent orders

Key Capabilities

Financial KPIs

  • Total Revenue calculated from income account journal entries
  • Total Expenses calculated from expense account journal entries
  • Net Profit: revenue minus expenses, real-time
  • Cash Balance: current cash position across all cash accounts
Revenue Chart

  • 12-month rolling revenue trend line
  • Based on your fiscal year settings
  • Monthly breakdown of income
  • Visual trend analysis for growth tracking

Expense Breakdown

  • Pie/donut chart showing expense categories
  • Configurable: choose which accounts appear on dashboard
  • Groups smaller accounts for clarity
  • Quick identification of top cost areas

Receivables Dashboard

  • Total amount owed by customers
  • Top 4 customers by outstanding balance
  • Unused credits / customer prepayments
  • Quick link to customer details and payment collection

Payables Dashboard

  • Total amount owed to suppliers
  • Top 4 suppliers by outstanding balance
  • Prepaid amounts to suppliers
  • Quick link to supplier details and payment scheduling

Recent Activity

  • Last 5 orders with supplier, amount, date, and status
  • Last 5 containers with customer, amount, date, and status
  • Quick navigation to any order or container

Business Value

Make informed decisions in seconds. No need to dig through reports. Your financial health, top customers, top suppliers, and recent activity are always one click away.

Ready to streamline your operations?

Get Started